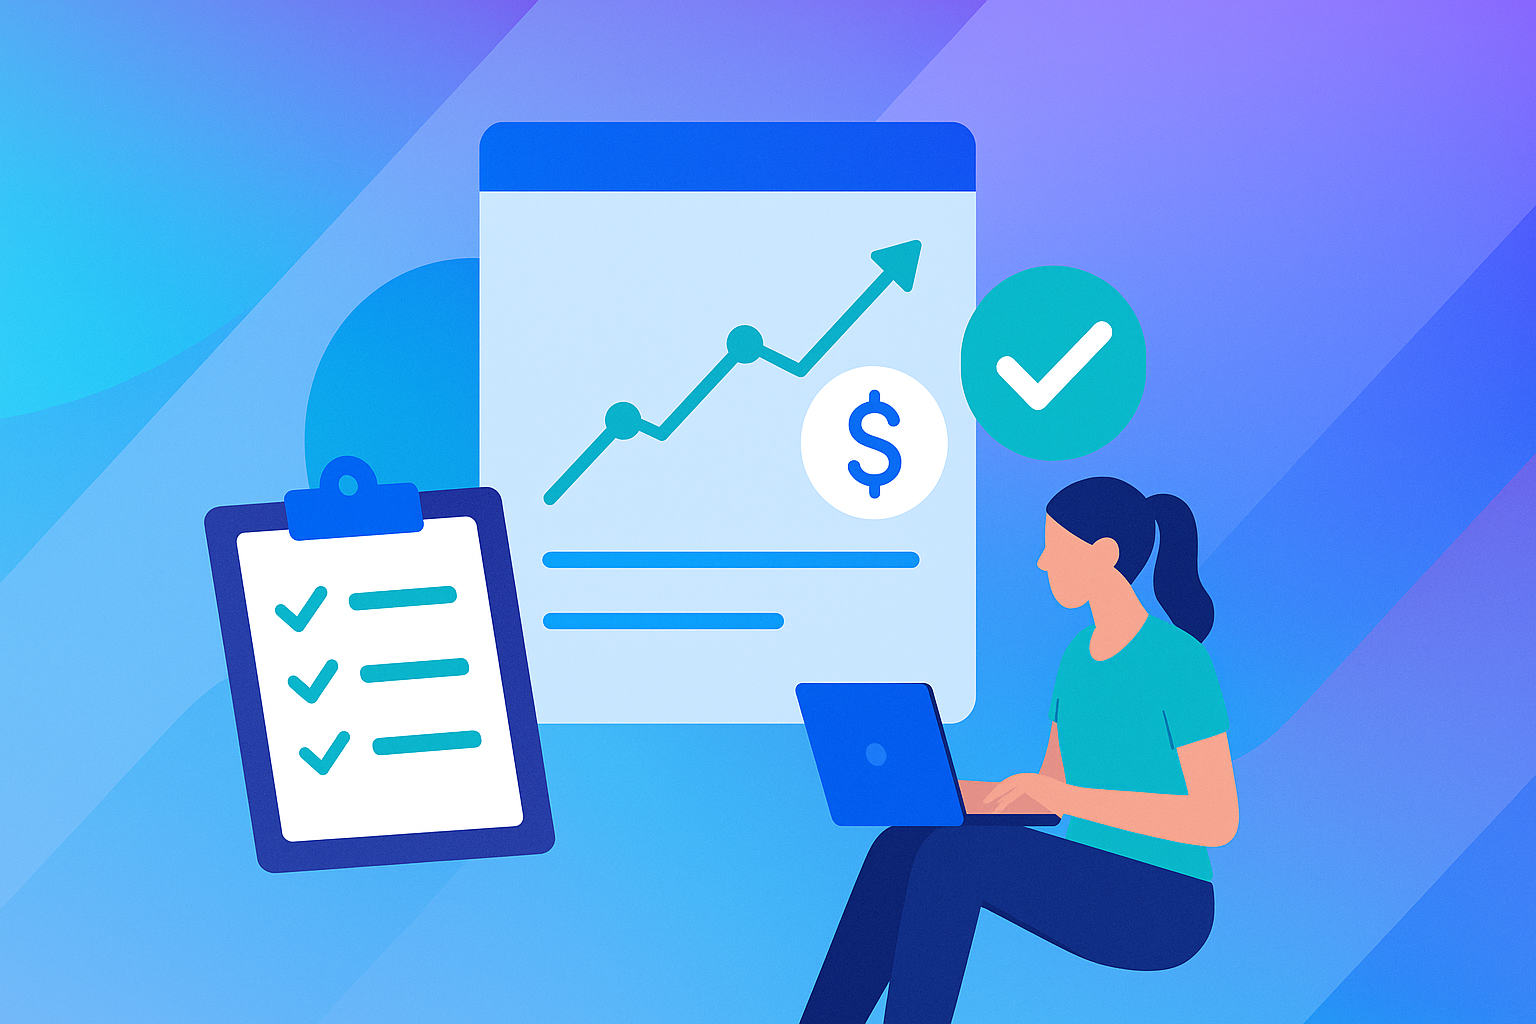
How to Measure and Improve Event ROI

Event organizers often ask the same question: Was it worth it? Measuring event ROI gives you the answer. From justifying budgets to planning smarter strategies, knowing how to calculate ROI is the key to proving your event’s value and improving the next one.
Why Event ROI Matters
Events represent a major share of marketing spend. Organizers who measure ROI consistently are far more likely to win budget increases in future years. By tracking ROI, you can:
- Prove your event’s business impact
- Justify expenses and sponsorship pricing
- Optimize future event strategies
Key Challenges in Measuring ROI
Event organizers often struggle with:
- Disconnected systems that scatter data across tools
- Unclear goals that make measurement difficult
- Long sales cycles that delay measurable results
Pro Tip: Start by defining clear objectives, then use event management software to bring registration, financial tracking, and reporting into one system.
Essential Metrics to Track
Attendee Feedback
Use post-event surveys to measure satisfaction, session quality, Net Promoter Score (NPS), and engagement levels. These insights reveal what resonated and what needs adjustment.
Financial ROI
Track event expense data against revenues. Consider ticket sales, sponsorships, and vendor costs. Don’t just measure dollars earned, look at whether expenses aligned with goals.
Lead Tracking
Monitor event registration form conversions, demo requests, and content downloads. This shows how effectively your event generates new opportunities.
Social Media Impact
Measure hashtag reach, engagement rates, and audience sentiment to evaluate your event’s visibility and influence beyond the venue.
Income vs. Expenses Breakdown
To calculate event ROI, you need accurate numbers for both revenue and expenses. Successful events typically generate returns in the 25–34% range, but every event is unique.
Three common calculation models:
| Model Type | Formula | Best Used For |
|---|---|---|
| Return/Investment | Revenue ÷ Expenses | Quick assessments |
| Incremental Revenue | (Revenue – Expenses) ÷ Expenses | Profit-focused analysis |
| Incremental Margin | (Gross Margin – Expenses) ÷ Expenses | Comprehensive evaluation |
Example: If your event earned $50,000 and cost $40,000, ROI = (50,000 ÷ 40,000) × 100 = 125%.
For more detailed tips, explore our guide on event budgeting strategies.
Lead Tracking Made Simple
Leads connect event participation directly to long-term business results. Sync your event registration forms with your CRM to track conversions automatically.
Practical lead metrics to monitor:
- Email signup conversions
- Demo registrations
- Content downloads
- Contact form completions
Pro Tip: For B2B events with long sales cycles, track multiple touchpoints (webinar attendance, booth scans, follow-up calls). For community events, focus on direct registrations and repeat attendance.
Social Media Results
Social media offers real-time indicators of success:
- Hashtag reach shows how far your event spread
- Engagement rates reveal how actively participants interacted
- Share of voice benchmarks your event against others
- Sentiment analysis highlights positive or negative buzz
Actionable Insight: Encourage attendees to post photos or highlights during the event using a branded hashtag. Monitor these posts to spot engagement spikes and respond in real time.
Event ROI Management Tools
Modern event management software makes ROI tracking easier. With ClearEvent, you can:
| Feature | Function | How It Helps |
|---|---|---|
| Budget Dashboard | Track expenses and revenue in real time | Stay on top of finances instantly |
| Attendance Analytics | Review registration data automatically | Spot trends across sessions and ticket types |
| Custom Reports | Visualize data in multiple ways | Share tailored insights with stakeholders |
| Integration Hub | Connect CRM and marketing tools | Eliminate manual data entry and errors |
With all your event data in one place, ROI measurement becomes less about chasing spreadsheets and more about making informed decisions.
Creating Effective Event Surveys
Surveys provide context that numbers can’t capture. Structure them around three phases:
- Pre-event survey: Ask about attendee goals, expectations, and past experiences
- Post-event survey: Collect feedback on sessions, speakers, and overall value
- Follow-up survey: Check in weeks later to learn if attendees applied what they learned or gained measurable business value
Actionable Insight: Keep surveys short! 5–7 focused questions increases completion rates without overwhelming attendees.
Data System Integration Tips
To make ROI tracking seamless, connect your tools:
- Map where data is collected (registration, payments, surveys)
- Sync registration forms with your CRM
- Connect payment processors to accounting systems
- Integrate attendance tracking with marketing automation
Pro Tip: Start small. Automating even one workflow, like sending registrant data directly into your CRM, can save hours of manual entry.
Industry Benchmarks and Trends
When evaluating ROI, compare against industry benchmarks:
- Trade shows often achieve 25–34% ROI
- Many organizations report $4–$5 earned per $1 spent on events
- Lead conversion rates typically range from 5–10%
- The global events industry is projected to reach $2.1 trillion by 2032
Virtual and hybrid formats are also growing rapidly, with the market expected to reach $657 billion by 2030.
Applying ROI Data to Future Events
Use ROI data to identify performance gaps and optimize planning:
- Session attendance: See which tracks drew the biggest crowds
- Engagement metrics: Review Q&A activity, networking participation, and app usage
- Revenue streams: Compare ticket sales, sponsorships, and merchandise
- Expense analysis: Flag costs that didn’t provide enough return
Example: If your highest-cost speaker drew the lowest engagement, reallocate funds next time to formats that drive more interaction.
Budget Planning with ROI Insights
Your budget should evolve as you learn from past results.
Short-term adjustments:
- Shift spend from underperforming channels to those with better ROI
- Reevaluate vendor contracts based on real value delivered
Long-term planning:
- Build conservative forecasts using historical data
- Set aside contingency funds for unexpected costs
- Scale proven tactics, like VIP ticketing or sponsor activations
Revenue streams often include ticket sales, merchandise, and sponsorships so it’s worth learning how to maximize sponsor visibility at live events to increase ROI.
Event Format Improvements
ROI data also guides event design. Use insights to:
- Shorten or extend sessions based on attendance patterns
- Rearrange floor plans to improve traffic flow
- Add networking areas where engagement was highest
- Test gamification features to boost participation
Track improvements using post-event surveys, real-time data, and comparative analysis across events.
Key Takeaways
Tracking event ROI isn’t just about crunching numbers, it’s about creating a cycle of continuous improvement.
- Define Clear Goals: Link event success to broader business objectives
- Integrate Systems: Connect registration, expense tracking, and analytics tools
- Measure Continuously: Evaluate before, during, and after your event
When you combine event expense tracking, attendee feedback, and lead data, you’ll see exactly what’s working and what needs to change. With the right event management software, measuring ROI becomes a built-in part of your event planning process. For a step-by-step approach to organizing your next event, read our event planning checklist article.
How to Get Started
- Define success in clear, measurable terms
- Select an ROI calculation model that matches your event’s purpose
- Track baseline metrics with event registration forms, budget dashboards, and engagement tools
- Use software to automate data collection and reporting
Ready to simplify how you measure and improve event ROI? Explore ClearEvent’s all-in-one event management software with a personal live demo and see how easy it can be.
Frequently Asked Questions (FAQ)
How do you calculate event ROI?
Event ROI is calculated by dividing your event revenue by expenses, then multiplying by 100. For example, if your event earned $50,000 and cost $40,000, the ROI would be 125%. Choosing the right formula depends on whether you’re measuring ticket sales, sponsorships, or broader outcomes.
What expenses should I include when tracking event ROI?
Include all direct and indirect costs, such as venue rental, catering, marketing, technology, and staff time. Accurate event expense tracking ensures you don’t overlook hidden costs that could reduce profitability. The more detailed your expense data, the more reliable your ROI calculation.
Can I measure ROI for free events?
Yes. Even if no revenue is generated, you can measure ROI by looking at outcomes such as leads generated, attendee satisfaction, or new partnerships formed. Free events often deliver value in awareness, engagement, or future sales opportunities.
Why should I use event management software for ROI tracking?
Event management software consolidates registrations, budgets, surveys, and reporting into one platform. This eliminates manual data entry, reduces errors, and provides real-time insights. It makes ROI measurement faster, more accurate, and easier to share with stakeholders.
What’s a good ROI benchmark for events?
Industry data shows that many trade shows and conferences achieve 25–34% ROI. However, benchmarks vary by event type and goals. Instead of focusing only on averages, compare your results against your own past events to see consistent improvement over time.