Measuring event ROI is essential for proving value, justifying budgets, and improving future strategies. Here’s a quick overview of how to track and optimize event ROI effectively:
Why It Matters: Events account for 24% of marketing budgets and ROI averages 25–34%, making measurement critical for aligning with business goals.
Key Challenges: Common obstacles include disconnected systems, unclear goals, and long sales cycles. Solutions involve CRM integration, clear objectives, and lead tracking.
Essential Metrics:
Attendee Feedback: Use surveys to measure satisfaction, session quality, NPS, and engagement.
Financial ROI: Calculate using revenue vs. expenses and advanced formulas.
Lead Tracking: Monitor email signups, demo registrations, and content downloads.
Social Media Results: Track hashtag reach, engagement, and sentiment analysis.
Tools: Platforms like ClearEvent simplify ROI tracking with budgeting dashboards, analytics, and CRM integrations.
Actionable Tips:
Set measurable goals.
Use integrated systems for data collection.
Continuously monitor metrics before, during, and after events.
Here’s what to focus on when collecting feedback:
Metric Type
What to Measure
Collection Method
Satisfaction Score
Overall event experience
1-10 rating scale
Session Quality
Content relevance and speaker impact
Session-specific surveys
Net Promoter Score (NPS)
Likelihood to recommend
Standard NPS question
Engagement Level
Participation and interaction rates
Event app analytics
“We look at feedback, for the most part, we look at audience feedback, we do a survey of course, like every other event, but I personally speak with probably hundreds of attendees in the run-up to, at the conference, following the conference, and some who attend every year.” – Andrea Rosen, Head of Communications, Adobe Design
Income vs. Expenses Breakdown
To calculate financial ROI, you need to track both revenue and expenses in detail. On average, successful events achieve a 25-34% ROI[1].
“Calculating event ROI involves more than subtracting costs from revenue. You have to factor in your time, energy and resources as well.” – Yuliya Datsyuk, Content Manager [1]
For nonprofits, the goal is typically an ROI exceeding 70% of total organizing costs [2]. Below are three common ROI calculation methods:
Model Type
Formula
Best Used For
Return/Investment
Revenue ÷ Expenses
Quick assessments
Incremental Revenue
(Revenue – Expenses) ÷ Expenses
Profit-focused analysis
Incremental Margin
(Gross Margin – Expenses) ÷ Expenses
Comprehensive evaluation
Once financial results are clear, the next step is to track how these numbers connect to business outcomes, like lead generation.
Lead Tracking Results
Tracking leads effectively means syncing your event software with your CRM. For complex B2B sales cycles, multi-touch attribution models are ideal. For shorter sales processes, single-touch models work well [3].
In addition to leads, social media metrics can provide insights into your event’s reach and live engagement.
Social Media Results
Social media data gives you a snapshot of your event’s visibility and audience interaction. Key areas to measure include:
Hashtag reach and usage
Engagement rates during the event
Share of voice compared to competitors
Sentiment analysis of event-related posts
Using event technology platforms, you can consolidate these metrics for easier analysis. Regular tracking allows you to make real-time adjustments and fine-tune your strategy for better outcomes.
ROI Tracking Tools and Methods
Tracking event ROI today requires reliable tools and organized data collection. Let’s look at some practical solutions for gathering and analyzing performance metrics.
Once you’ve gathered financial and attendance data using ClearEvent, you can move on to designing surveys for qualitative feedback.
Creating Effective Event Surveys
Well-structured surveys are key to gaining actionable insights. Here’s how you can approach them:
Pre-event Baseline Survey
Ask attendees about:
Their primary goals for attending
Expected learning outcomes
Networking objectives
Past event experiences
Post-event Evaluation
Gather feedback on:
Specific sessions
Speaker performance
Venue experience
Overall value of the event
Follow-up Impact Survey
Check in after the event to learn:
How they’ve applied what they learned
Any business value they gained
Their likelihood of attending again
Perceived ROI from the event
When combined with integrated data systems, these surveys offer a well-rounded view of your event’s ROI.
Data System Integration Tips
Bringing together your data systems is essential for a unified and complete ROI analysis.
Map Your Data Flow
Pinpoint where data is collected
List the metrics you need
Set priorities for integration
Choose Tools That Work With Your Systems
Make sure your tools align with:
CRM platforms
Marketing automation software
Financial tracking tools
Social media analytics
Sync Your Data
Link registration forms to your CRM
Connect payment systems to accounting software
Tie attendance tracking to marketing platforms
sbb-itb-fd7582d
ROI Calculation Guide
Understanding how to calculate ROI is crucial for justifying budgets and improving future events. Here’s how you can calculate event ROI using three different methods and compare your results to industry benchmarks.
Basic ROI Formula
This straightforward formula works well for events primarily focused on ticket sales:
ROI = (Event Revenue / Event Expenses) × 100
For example, if your event generates $50,000 in revenue and costs $40,000, the ROI would be 125%.
Advanced ROI Formula
This method provides a deeper analysis by factoring in net profit:
Using the same numbers: (($50,000 – $40,000) / $40,000) × 100 = 25% ROI.
Complex ROI Formula
This approach is ideal for events like trade shows or product launches, where the cost of goods sold (COGS) is a factor:
ROI = ((Gross Margin – Event Expenses) / Event Expenses) × 100 Gross Margin = Event Revenue – Cost of Goods Sold
Including COGS gives a more detailed picture of profitability.
Industry Benchmarks and Trends
Industry data can provide helpful context for your ROI results. Here are some key figures:
Many trade shows report ROI figures between 25% and 34%.
Fortune 500 companies often see $5 earned for every $1 spent on trade show exhibitions.
Lead conversion rates for trade shows typically range from 5% to 10%.
The global events industry is estimated to hit $2.1 trillion by 2032.
When assessing your event’s performance, don’t just focus on immediate financial returns. Consider long-term value metrics and track ROI across events to uncover patterns and areas for improvement.
Applying ROI Data to Next Events
Finding Performance Gaps
Use ROI data to uncover areas that need improvement. By analyzing attendee behavior and engagement metrics, you can identify weak spots in your event strategy.
For example, Queen Bee’s Art & Cultural Center boosted VIP ticket sales by switching from email campaigns to targeted social media ads [4].
Key performance indicators to track include:
Session attendance rates: Compare attendance across different tracks and time slots to spot trends.
Engagement metrics: Keep an eye on Q&A participation, networking activities, and content downloads.
Revenue streams: Identify which ticket types, sponsorships, or services brought in the most money.
Cost centers: Pinpoint expenses that didn’t deliver enough value.
Budget Planning with ROI Data
Performance analysis helps you make smarter budget decisions. Historical data can guide where to allocate funds for the best results.
“You should be in that budget every single day, pretty much. Anytime you get an invoice, anytime you get an estimate from a vendor, you have to be updating in real time to share with your finance team”.
Here are some strategies to optimize your budget:
Short-term Adjustments:
Shift funds from underperforming areas to activities with higher returns.
Reevaluate vendor relationships based on the value they deliver.
Fine-tune marketing spend by focusing on the best-performing channels.
Long-term Planning:
Use past data to create conservative revenue forecasts.
Set aside contingency funds for unexpected costs.
Develop plans to scale successful elements of your event.
Event Format Improvements
Take your event design to the next level by applying ROI insights. These tweaks can help increase engagement and overall satisfaction:
Adjust session lengths based on attendance patterns.
Rearrange floor plans to improve traffic flow.
Expand networking opportunities in areas with high engagement.
Add gamification features to encourage participation.
Monitor the impact of these changes through:
Post-event surveys from both attendees and speakers.
Real-time activity tracking during the event.
Analysis of lead behavior.
Session attendance metrics.
Revenue performance data.
ROI-Based Event Planning
Key Takeaways
Tracking event ROI is essential in a booming industry projected to hit $2.1 trillion by 2032, with average returns ranging from 25–34%. To make the most of your events, focus on these core elements:
Define Clear Goals: Use SMART objectives to link your event’s success to broader business outcomes.
Integrate Your Data: Combine CRM insights, attendee feedback, and engagement metrics for a full picture of performance.
Monitor Continuously: Measure key metrics before, during, and after your event to spot patterns and opportunities.
With the virtual events market expected to grow to $657 billion by 2030, ROI tracking is just as important for hybrid and digital formats.
How to Start Tracking ROI
To put these principles into action, start by setting specific, measurable goals and selecting an ROI model that matches your event’s purpose. Identify baseline metrics like engagement, web traffic, social media activity, and lead conversions.
Leverage specialized software to automate data collection and analysis. This saves time, reduces errors, and provides real-time insights, helping you make informed decisions throughout the event cycle.
Planning a live event? Start with a clear budget. Here’s why it matters:
Control Costs: Avoid overspending by tracking every expense.
Prepare for Surprises: Save 10-20% of your budget for unexpected costs.
Set Priorities: Allocate funds to the most critical aspects like venues, catering, and marketing.
Measure Success: Use your budget to evaluate event performance later.
Key steps include:
Define event goals and estimate attendance.
Break costs into categories: venue, staff, marketing, and technical needs.
Research vendor quotes and past budgets for accurate estimates.
Track spending with tools like ClearEvent or Excel.
Reserve emergency funds and review your budget post-event for improvements.
Quick Tip: On average, large conference venues cost $950–$1,250/hour, while AV setup runs $1,100–$1,400. Plan accordingly!
1. Event Goals and Requirements
Define the Event’s Purpose
Start by clarifying why you’re hosting the event and what you want to achieve.
“Event budgeting allows you to host events within your organization’s financial means that still achieve your event objectives”.
Set SMART goals – specific, measurable, achievable, relevant, and time-bound. For instance, Marketing 360 aimed to boost website visitor-to-ticket conversions by 5%, ensuring their resources were focused on a clear, actionable target.
Once you’ve nailed down the purpose and goals, you can estimate attendance and refine your spending categories.
Estimate Attendance
Your attendance numbers will shape key parts of your budget:
Venue sizing: Determines fixed costs like rental fees and setup expenses.
Variable costs: Affects per-person expenses, such as catering and materials.
Revenue planning: Helps calculate ticket prices and sponsorship needs.
After estimating attendance, you’ll have a better idea of the funding needed for different components.
Identify Key Budget Categories
Break down your event into essential areas that need funding:
Category
Key Considerations
Venue & Logistics
Space, AV equipment, furniture
Program Elements
Speakers, entertainment, content creation
Attendee Experience
Food, beverages, registration materials
Marketing & Promotion
Advertising, signage, branding materials
Technical Needs
Event software, internet connectivity
Staff & Support
Coordinators, security, technical help
To organize your budget, consider the BSQ framework:
Think Big: Picture the ideal outcome for your event.
Act Small: Break larger goals into manageable tasks.
Move Quickly: Allocate funds based on your top priorities.
With 68% of meetings in North America now fully in-person and 83% incorporating an in-person element, it’s wise to focus on physical venues and attendee experiences, while staying open to hybrid options.
These steps create a strong foundation for planning and tracking your event budget in detail.
2. Cost Categories and Expenses
Organizing your budget into clear categories ensures all expenses are accounted for. These categories align with your event goals and form the foundation of your financial planning.
Venue Costs
Venue fees often take up the largest portion of your budget. On average, event spaces cost between $950 and $1,250 per hour. Be sure to account for:
Base rental fees
Insurance and necessary permits
Charges for setup and breakdown time
Utilities and service fees
Parking arrangements
Additional room rentals, if needed
Technical Requirements
For technical needs, plan to spend $1,100–$1,400 for equipment setup and $350–$450 per day for each AV technician. Here’s a breakdown of essential equipment:
Equipment Type
Includes
Audio
Speakers, microphones, mixing boards
Visual
Projectors, screens, LED displays
Lighting
Stage lights, ambient effects
Recording
Cameras, live streaming tools
Support
Power supplies, cables, backup systems
Staff Costs
Staffing costs depend on the roles and experience levels required. Current market rates include:
Wait staff: $25/hour
Event helpers: $12/hour
Security personnel: $40/hour
Technical support: $350–$450 per day
Make sure to include hours for setup, the event itself, and breakdown in your calculations.
Marketing Expenses
Marketing efforts typically require a starting budget of $5,000 for basic promotion. Common expenses include:
Digital ad campaigns
Printed materials and signage
Event branding and design
Public relations efforts
Social media outreach
Registration materials
Extra Funds and Backup
Set aside 10–15% of your budget as a contingency for unexpected costs. Additionally, plan for about $2,100 per day for rental equipment and supplies.
Using event management software like ClearEvent can simplify expense tracking. These tools provide real-time updates on spending across all categories, helping you stay on top of your financial plan.
3. Cost Research Methods
Getting your event budget right starts with solid research and tracking. Here are some practical ways to gather accurate pricing details.
Get Vendor Quotes
Reach out to multiple vendors for each expense category and request detailed quotes. Create a comparison matrix to evaluate their base prices, extra fees, service terms, insurance coverage, and track records. This makes it easier to spot the best value for your event.
Review Past Budgets
Once you’ve collected vendor quotes, take a look at budgets from similar past events. Adjust for inflation and current market trends, and note any unexpected expenses. This can help you spot areas to cut costs or where additional funds might be needed.
Use Budgeting Tools
Consider using budgeting tools like ClearEvent, which provides a built-in budget manager and customization options. A satisfied user shared:
“The app guides you through everything needed to plan your event. A real game-changer!” – Shannon M., Treasurer (Arkansas Chapter of APCO)[1]
For smaller or simpler events, a well-organized Excel spreadsheet can also do the job effectively.
sbb-itb-fd7582d
4. Budget Setup and Tracking
Organize Budget Categories
Start by dividing your budget into clear sections. Focus on major areas like venue, marketing, and technical needs. If you’re hosting a hybrid event, make separate sections for the in-person and virtual components.
Within each category, break it down further. For example, under marketing, you might include sub-items like social media ads, email campaigns, and printed materials. Once your categories are set, you’re ready to start adding numbers.
Input and Calculate Costs
Log both estimated and actual costs for each line item. Tools like Microsoft 365 Business Standard ($12.50 per user/month) can simplify this process with its spreadsheet features [2]. Use columns to organize your data:
Column Name
Purpose
Estimated Cost
Your initial budget projection
Negotiated Price
The final price agreed upon
Actual Spend
The real amount you paid
Variance
The difference between estimate and actual
This setup helps you monitor your budget with precision.
Monitor Spending
Once your categories and costs are in place, consistent tracking is key to staying within budget. For instance, Lincoln Financial Group tracked 450 meetings annually using an event management platform and saved $1.4 million while boosting attendance by 22%.
Here are some tips for staying on top of your spending:
Review and compare your budget weekly.
Document any changes or adjustments.
Set reminders for vendor payments to avoid late fees.
“Keeps things like costs and payments organized and in one place for everyone. I especially love the budgeting and timeline tools.” – Gretchen Culver, Rocket Science Events [3]
Event management tools like ClearEvent ($895/year for single events) can make this even easier. These platforms often offer real-time expense tracking and automated alerts to notify you when you’re nearing spending limits.
5. Emergency Funds and Budget Approval
Add Emergency Funds
Always plan for the unexpected by including a safety buffer in your event budget. Aim to reserve about 15% of your total budget for unforeseen expenses. Factors like the event’s complexity, weather conditions, technical backup needs, vendor dependability, and potential price changes should guide this allocation.
Make sure to document these emergency funds clearly in your budget. Incorporate them into your overall financial plan before presenting it to stakeholders, ensuring transparency and preparedness.
Get Budget Approval
Once your budget is detailed and includes contingency planning, focus on getting stakeholders on board. Prepare a thorough budget proposal that demonstrates careful planning and highlights the potential return on investment (ROI).
Your proposal should include:
A clear breakdown of fixed and variable expenses
Revenue projections
ROI estimates
Cash flow details
Emergency fund allocation
Back up your proposal with data like historical results, industry benchmarks, market research, and risk evaluations. Tools like ClearEvent can simplify this process by offering built-in budget tracking features, helping you keep stakeholders informed and confident in your plan.
6. Budget Review After Event
Reviewing your budget after the event helps refine your planning process for the future.
Compare Costs
Analyzing your event’s performance after it ends can highlight areas for improvement and measure ROI. To do this, calculate variances using this formula: expenses = Planned – Actual; revenue = Actual – Planned.
Create a spreadsheet that tracks key financial details, such as fixed costs, variable expenses, revenue streams, emergency fund usage, and any unexpected costs. According to industry data, 23% of event planners don’t measure success, and 18% lack proper evaluation tools. Focus on these important metrics:
Metric Type
What to Track
Why It Matters
Financial Performance
Cost per attendee, profit margin, ROI
Understands event profitability
Marketing Efficiency
Cost per acquisition, conversion rates
Assesses promotional effectiveness
Operational Costs
Venue utilization, staff efficiency
Identifies potential savings
Revenue Sources
Ticket sales, sponsorships, merchandise
Tracks income diversification
These comparisons will guide your detailed post-event review.
Record Budget Notes
After comparing costs, document your findings and recommendations. Include these in a post-event financial report:
Variance Analysis
Identify the reasons behind cost differences. Highlight accurate estimates, note adjustments needed, and record unexpected expenses for better planning next time.
Performance Metrics
Log measurable data like attendance numbers, revenue per attendee, marketing ROI, and operational cost efficiency.
Action Items
List specific steps to improve future events. This could include revising vendor contracts, updating pricing strategies, finding cost-saving measures, or identifying new revenue opportunities.
Store all financial records digitally for easy access later. This ensures your team can quickly retrieve data for planning future events more efficiently.
Next Steps
Now that you’ve got the basics of event budgeting down, it’s time to put them into action. Start by downloading a budget template, setting up a cost tracking system, and determining your financial baseline.
ClearEvent provides a platform tailored for live events, complete with pre-loaded revenue and expense categories. This makes it easier to track costs and maintain accurate financial records.
Here’s how you can use practical tools to manage your budget effectively:
Step
Tool
Benefit
Setup
Starter Budget Template
Clearly organized expense categories and revenue sources
Tracking
Financial Dashboard
Real-time updates on spending
Managing
Mobile Event App
Quick expense logging and approvals
Reviewing
Built-in Reports
Detailed financial insights after the event
These tools help you stay on top of expenses in real time and simplify the entire budgeting process for your event.
Planning a multi-day conference schedule can feel overwhelming, but it’s crucial for a smooth event and satisfied attendees. Missteps like overlapping sessions, overcrowded rooms, or last-minute speaker changes can lead to frustration and bad reviews. Here’s how to avoid those pitfalls and create a seamless schedule:
Start Strong: Begin each day with engaging keynotes and build in buffer times to handle delays.
Mix It Up: Use varied session formats (e.g., workshops, panels, networking) to keep attendees engaged.
Use Tools: Platforms like ClearEvent simplify scheduling, communication, and updates.
Prevent Overlaps: Label tracks clearly, avoid similar topics at the same time, and use scheduling software to flag conflicts.
Communicate Changes: Share updates in real-time via apps, email, or digital signage.
Conference & Corporate Event Planning Template
Creating Your Conference Schedule
Planning a multi-day conference requires careful thought to ensure attendees get the most out of their experience.
Setting Daily Schedules
Each day should start with a clear, engaging agenda. A well-organized daily schedule might include:
Morning Power Hours: Begin with inspiring keynotes or workshops to energize participants.
Regular Breaks: Add breaks for networking, refreshments, and recharging.
Afternoon Variety: Offer a mix of interactive sessions to maintain interest.
Buffer Time: Build in short transition periods to handle potential delays.
Mixing Session Types
A mix of session formats helps maintain interest and caters to different learning styles. Dr. Indumathi Bendi notes, “Carrying out routine activities reduces stress by making the situation appear more controllable and predictable” [1].
Time Block
Session Type
Engagement Level
Duration
Morning
Keynote Presentations
High
45–60 minutes
Mid-Morning
Interactive Workshops
High
90 minutes
Afternoon
Panel Discussions
Medium
60 minutes
Late Afternoon
Networking Activities
Medium-Low
45 minutes
By alternating session formats, you can appeal to a variety of preferences and keep the day flowing smoothly.
Managing Multiple Tracks
If your conference has parallel sessions, clear organization is key. For example, the HubSpot Inbound Conference uses separate tracks for marketing, sales, and customer success, helping attendees easily find sessions that match their goals. To manage multiple tracks effectively:
Use labels, color-coding, or tags to help attendees navigate.
Avoid scheduling similar topics at the same time across tracks.
Keep time blocks consistent across all tracks for simplicity.
Apply buffer times uniformly to prevent overlaps.
A well-structured schedule ensures attendees can focus on learning and networking without confusion, setting the stage for the next step: leveraging digital tools.
Digital Tools for Schedule Management
Digital tools have become essential for managing modern conferences. They simplify scheduling and improve the overall experience for attendees and organizers.
Schedule Management Platforms
Platforms like ClearEvent are popular choices for streamlining event management. ClearEvent provides an all-in-one solution for $895/year, offering unlimited attendee management and detailed reporting.
Features to Look For
When choosing a scheduling tool, focus on platforms that offer these key features:
Unlimited attendees, detailed reporting, team collaboration
Mid-sized conferences
$895/year
Whova
Comprehensive tools for registration, engagement, and abstract submissions
Large conferences
Custom pricing
Eventbrite
Easy-to-use interface, built-in marketing tools
Smaller events
Pay-per-ticket
Sched
Customizable schedules, session management
Academic conferences
Custom pricing
sbb-itb-fd7582d
Session Timing and Flow
Break and Session Duration
Keeping attendees engaged hinges on effective session timing. Studies suggest the human brain can maintain focus for up to 90 minutes before fatigue sets in [2]. Aim to use 60–70% of the session for delivering content, leaving the rest for activities like Q&A or group discussions [3].
Here’s a quick guide to structuring session times:
Session Type
Duration
Break Length
Notes
In-Person Session
90 minutes
15–30 minutes
Includes Q&A and transition time
Virtual Session
90 minutes
30 minutes
Add 2–5 minute stretch breaks if needed
“Plan to use 60–70% of available time for content; interactive segments will fill the remainder. LESS IS MORE.”
Now, let’s look at how to avoid scheduling conflicts when managing multiple tracks.
Preventing Schedule Conflicts
Handling multiple tracks requires careful planning to steer clear of frustrating overlaps. Stan Kruss, CEO at Expo Centric, highlights the importance of preparation: “Use centralized scheduling software to track event dates and avoid overlaps. Communicate with vendors and stakeholders early, and confirm dates well in advance to minimize conflicts”[4].
To stay on top of scheduling:
Maintain a centralized event calendar as the single source of truth.
Factor in time zones for parallel sessions.
Add 15-minute buffers between sessions for flexibility.
Check for local events or industry conferences that could impact attendance.
Use scheduling tools to automatically flag potential conflicts.
Once the schedule is streamlined, it’s time to focus on managing room and speaker transitions.
Room and Speaker Changes
With a solid schedule in place, ensure smooth room and speaker transitions by setting clear expectations and building in flexibility.
Here’s how to manage transitions effectively:
Collect all presentations at least 24 hours before the event to ensure proper formatting.
Use presentation management software designed for seamless session changes.
Assign moderators to keep speakers on track and on time.
Provide visual countdown timers to help speakers manage their allotted time.
“Clear and concise briefing is the key. Make it clear what you expect from the speaker, discuss content, and what you hope to achieve from the presentation. But don’t expect to micromanage a presentation. You employ a speaker for their expertise and you have to allow them to do their job.”
Bob Strange, Founding director at The Closer Speakers’ Consultancy Ltd
To handle unexpected delays or gaps, prepare backup content like short videos or panel discussions [5]. This ensures sessions stay on track without losing momentum.
Handling Schedule Changes
Once you’ve streamlined session flow and transitions, it’s time to prepare for the unexpected. A well-thought-out approach can help you handle schedule changes smoothly, ensuring your event stays on track.
Building Buffer Time
Adding buffer time into your schedule is like having a safety net – it helps you manage surprises without derailing the event. Research shows that too little buffer time can lead to stress and mistakes, while too much can drive up costs [6].
“Think of buffer time as a safety net in a circus – you can always count on padding time to catch you when your professional or personal circus acts become more daring than anticipated.”
– Aleksandra Doknic, Copywriter and Content Writer, Memtime [6]
Once you’ve built in buffers, the next step is to ensure you can communicate any changes clearly and quickly.
Communicating Updates
When schedules shift, real-time communication is key. Beth Lawrence, CMP, an award-winning event planner, highlights the importance of having clear communication channels in place:
“Attendees should know the channels they can expect to hear updates from ahead of time, whether that be a Slack group, via email, via push notifications or another method. Communicate in all methods as succinctly and concisely as you can, while answering all possible questions (ie, a room change? Where is the other room?). Have a two way feedback loop so that attendees who have any issues can reach someone on the team directly.” [7]
Here are some steps to ensure effective communication:
Establish a Communication Chain: Have a clear process for approving and sending updates.
Use Multiple Channels: Share updates through email, mobile app notifications, and digital signage.
Set Up Information Points: Place staff at strategic locations to assist attendees with questions.
Monitor Engagement: Track message delivery and confirm receipt for critical updates.
Using Attendee Feedback
Timely updates are one part of the equation, but gathering attendee feedback is just as important for improving future events. Stan Kruss, CEO of Expo Centric, sums it up well:
“Timely, transparent communication minimizes confusion and keeps attendees informed.” [8]
To make the most of attendee feedback:
Real-Time Monitoring: Use tools like mobile app surveys, session ratings, and social media tracking to gather feedback during the event. Assign a team to address urgent concerns as they arise.
Post-Event Analysis: Review key metrics such as schedule adherence, delay patterns, communication effectiveness, and attendee satisfaction to identify areas for improvement.
Conclusion
Key Planning Tips
Managing a schedule effectively requires a mix of technology, clear communication, and adaptability to handle unexpected changes. Recent statistics reveal that 41% of event planners now use AI tools for tasks like content creation, logistics, and analyzing data [9]. The goal? Boost engagement and efficiency in every session.
“Experiential marketing is no longer a trend; it’s a necessity. Events are becoming platforms for brands to create immersive experiences that resonate deeply with consumers. The focus is shifting from traditional one-way communication to interactive and engaging encounters”.
Here are some essential practices for better schedule management:
Plan at least three months in advance.
Keep sessions between 45 and 60 minutes, leaving 15-minute breaks in between.
Use event technology to centralize and streamline data.
Measure engagement with clear, actionable metrics.
When applied, these strategies pave the way for smoother operations and help align with emerging trends in event planning.
Future of Event Scheduling
The way conferences are scheduled is changing fast. For example, 57% of attendees now expect personalized event summaries.
“Sustainability is a top priority for event planners and attendees alike. Events are increasingly expected to have a minimal environmental impact”
Key trends shaping the future of event scheduling include:
AI-Powered Personalization: Smart tools that tailor schedules based on attendee preferences and behaviors.
Hybrid Event Models: A strong 86% of B2B organizations report seeing positive ROI within seven months of hosting hybrid events.
Improved Accessibility: Technology is making events more inclusive and accessible to all participants.
Real-Time Analytics: Data insights are being used to make quick and informed schedule adjustments.
Live events remain a powerful tool for building trust, with 77% of people reporting increased confidence in a brand after face-to-face interactions. This highlights the critical role of well-organized schedules in creating memorable and impactful experiences.
Want to make your event sponsors stand out and ensure they see results? Here’s how:
Event Branding Placement: Position sponsor logos in high-traffic areas and use digital tools like branded Wi-Fi networks and mobile apps to maximize impressions.
Digital Displays: Use LED screens, touch kiosks, or QR codes to showcase sponsor content and track engagement with analytics tools.
Sponsor Presentations: Schedule keynotes, panels, or workshops during peak hours to engage attendees and generate leads.
Social Media Promotion: Use platforms like Instagram, Twitter, and LinkedIn to create pre-event buzz, live updates, and post-event highlights.
Interactive Activities: Design engaging experiences like games or installations that encourage participation and social sharing.
Why it matters: These strategies combine physical and digital tactics to increase sponsor visibility, engage attendees, and deliver measurable ROI. Use tools like Google Analytics, social media metrics, and participant feedback to prove the value of sponsorships.
Quick Tip: Track success with metrics like attendance, engagement, and social media shares to refine and improve sponsor strategies for future events.
Event Sponsorship as a Smart Marketing Strategy
1. Event Branding Placement
Sponsor branding thrives when strategically positioned in high-traffic areas like entrances, lounges, or activity zones. A great example is INBOUND’s ASICS-sponsored workout studio, which turned a regular venue space into a dynamic experience with exercise classes and competitions.
To extend reach, use digital tools effectively. Offer Wi-Fi networks with branded names, showcase sponsor logos on event tracking pages, and play sponsor videos on venue screens during breaks. Keep branding consistent across emails, signage, merchandise, social media, and mobile apps to maximize exposure.
“The better you maximize impressions, the better your odds.”
Measure branding success with tools like Google Analytics and unique tracking links to monitor engagement and prove ROI. A mix of physical and digital branding ensures sponsors leave a lasting impression while delivering measurable outcomes.
Adding digital displays to your branding strategy can take sponsor visibility and engagement to the next level.
2. Digital Display Integration
Digital displays are a great way to highlight sponsor content throughout your event. Placing LED screens in busy areas like registration desks or refreshment zones lets you showcase rotating sponsor logos, videos, and messages where attendees are most likely to notice them. Interactive options, such as touch-screen kiosks or QR codes, can encourage attendees to engage directly with sponsor campaigns.
“Live Display makes it easy to promote sponsors on monitors, projection screens, and more. It can show sponsor messages, logos, banners, and pictures to attendees in a bold yet non-disruptive way.”
For events with multiple sponsors, you can rotate content based on sponsorship tiers, giving top-tier sponsors more visibility. Use analytics tools to track impressions and engagement, offering sponsors clear data on their ROI.
Connect these displays with your event’s mobile app and social media platforms to boost sponsor visibility even further. Always run technical checks and prepare backup content to avoid any disruptions during the event. By focusing on placement, interactivity, and performance tracking, digital displays can maximize sponsor exposure and deliver measurable results.
This approach lays the groundwork for even greater engagement, which can be expanded through sponsor-led presentations.
3. Sponsor Presentations
Sponsor presentations, when paired with strong branding and digital tools, can drive impressive attendee engagement. Scheduling these sessions during peak hours ensures better visibility. For instance, at Salesforce’s Dreamforce event, presentations held between 10 AM and 2 PM see 35% higher attendance compared to early morning or late afternoon slots.
Formats like keynotes, panel discussions, workshops, product demos, and Q&A roundtables work particularly well for these presentations.
“Educational sessions that focus on solving real industry challenges rather than direct product promotion generate 3x more qualified leads for sponsors”, according to data from HubSpot’s INBOUND conference.
Adding interactive elements like live polls and audience participation can make these sessions more engaging. This approach helps sponsors build stronger connections with attendees.
Tips for Effective Sponsor Presentations:
Share audience insights with sponsors to ensure their content aligns with the event’s themes.
Provide technical rehearsals to help sponsors prepare.
Set clear guidelines for presentations, including time limits.
Track success using metrics like attendance, feedback, and engagement data. Recording these sessions can also create valuable content for sponsors to use after the event, extending their reach.
Finally, don’t forget the power of social media. Promoting sponsor presentations online can significantly enhance their impact beyond the event itself.
sbb-itb-fd7582d
4. Social Media Promotion
Social media is a game-changer for boosting sponsor visibility and engaging audiences before, during, and after your event. The trick? Create content that puts sponsors in the spotlight without overdoing the sales pitch.
Tailor Your Approach to the Platform:
Use Twitter for real-time updates.
Leverage Instagram for eye-catching visuals and stories.
Turn to LinkedIn for professional, B2B-focused sponsorships.
A standout example comes from Etihad Arena during the UFC 267 event. Their use of a social media wall led to an impressive 84,140 social interactions and 1,054 pieces of user-generated content in just 48 hours [1].
Pre-Event Buzz
Create a unique, memorable hashtag.
Announce sponsors with purpose – make it exciting.
Use targeted ads to build anticipation.
During-Event Engagement
Keep the energy alive with tools like virtual photo booths, social media walls, and QR codes. A social media wall featuring live attendee posts adds a fun, interactive layer to the experience and encourages more user-generated content.
Post-Event Spotlight
Keep the momentum going by sharing event highlights, testimonials, and key metrics. These not only extend the sponsor’s visibility but also showcase the value they gained from the event.
To measure success, track engagement rates, hashtag usage, and click-through rates. These analytics help you prove value to sponsors and refine your strategies for the future.
Social media brings sponsors into the digital spotlight, while interactive tools create memorable, in-person brand connections.
5. Interactive Activities
Interactive activities turn sponsor visibility into engaging experiences, leaving a strong impression and delivering measurable results.
Interactive Installations
Examples like AT&T’s Multiball LED soccer activation at the 2023 MEXTOUR and PATRÓN Tequila’s Batak Pro Challenge at the U.S. Grand Prix highlight how brands can match their identity with the event’s vibe [2]. Similarly, Wendy’s life-sized claw machine at Adult Swim’s Block Party and Uber Eats’ themed Super Bowl pop-up shop show how these setups can boost visibility and inspire social media buzz [2][3].
Tracking and Execution
Key metrics to monitor include:
Participation rates
Click-through rates
Social media shares
Attendee actions
Ensure activities naturally showcase the brand, fit the event’s theme, and encourage attendees to share their experiences online. These shared moments can expand sponsor reach through organic engagement.
Conclusion
Increasing sponsor visibility requires a blend of both offline and online tactics. The five methods outlined offer event organizers reliable ways to provide value to sponsors while improving the overall event experience.
Measuring Impact and Success
Modern event tools make it easier to track and measure the success of sponsorships. Key metrics to monitor include:
Digital engagement: such as page views and click-through rates
Social media performance: including hashtag usage and mentions
Participation in interactive activities
Lead generation outcomes
Session attendance figures
These insights help organizers refine their efforts to ensure sponsors see real results.
Strategic Execution
Successful sponsor visibility depends on careful planning. Top events show how well-placed sponsor activations can engage audiences through:
Smart placement of digital displays
Focused social media campaigns
Engaging, interactive sponsor-driven activities
Planning for Future Results
By combining well-executed strategies with measurable outcomes, event organizers can deliver consistent value to sponsors and build stronger relationships. This approach helps sponsors achieve their goals while ensuring long-term collaboration opportunities.
The secret to ongoing success is refining these strategies over time and maintaining a sharp focus on delivering measurable results that align with what sponsors want.
FAQs
What is a good ROI for sponsorship?
A strong sponsorship ROI typically means sponsors earn at least $2 in value for every $1 spent on the event. This value can come from direct results like revenue and leads, as well as brand-related benefits like increased awareness and stronger relationships.
Type
Measurements
Tools
Quantitative
Sales growth, lead captures, click-through rates
Google Analytics, CRM systems
Qualitative
Brand awareness, audience engagement, social mentions
Surveys, social listening tools
Take AT&T’s Multiball LED soccer activation during the 2023 MEXTOUR as an example. They achieved a 3.5x ROI by blending direct sales with over 50,000 participant interactions and a 40% boost in brand awareness [2].
To track ROI effectively, event organizers should:
Set clear goals before the event begins
Use tracking systems to monitor digital and in-person engagement
Deliver post-event reports with actionable insights and measure long-term effects through follow-up surveys
Tracking ROI doesn’t just justify sponsor spending – it also pinpoints which strategies, like branding efforts, social media campaigns, or interactive experiences, worked best [3][4]. This helps organizers show value to sponsors and improve future events.
Event registration is riddled with challenges, but solutions exist to fix them. Here’s a quick overview of the most common problems and how to address them effectively:
Slow or crashing websites: Use load testing and scalable cloud infrastructure to handle traffic spikes.
Payment failures: Implement dual payment gateways and real-time monitoring to improve success rates (up to 98%).
Long, complex forms: Reduce fields to 5-7 essentials and use smart validation for better completion rates.
Mobile issues: Optimize forms for mobile with lightweight pages and single-column layouts.
Data security concerns: Protect attendee data with encryption, role-based access, and automated backups.
Check-in delays: Use self-service kiosks and QR codes to speed up lines and reduce wait times.
Streamlining these areas can reduce form abandonment, boost attendee satisfaction, and protect your event’s reputation. Let’s dive into the details.
Technical Problems and Solutions
These strategies directly tackle the brand perception risks discussed earlier. Platforms like ClearEvent have shown that achieving a 98% payment success rate is possible.
Handling Website Crashes and Traffic Spikes
To avoid website crashes during high-traffic events, focus on load testing and scalable infrastructure. Here’s how:
1. Pre-Event Load Testing
Running continuous load tests for over 72 hours is key. For example, during the 2024 Global Tech Summit, this method helped manage a 300% surge in registrations without any downtime. Effective testing involves:
Simulating 500-10,000 concurrent users.
Matching peak traffic hours based on your audience’s time zones.
Conducting tests at least 48 hours before launch.
2. Cloud Infrastructure
Using scalable cloud solutions like Microsoft Azure auto-scaling is now standard practice. This approach allows dynamic server adjustments, preventing 94% of potential crashes.
Fixing Payment Processing Errors
Payment issues can lead to frustrated attendees. The best way to address this is by combining several tools and techniques:
Use multiple payment processors (e.g., Stripe and PayPal).
Monitor transactions in real-time.
Implement pre-authorization holds to reduce failed payments.
Payment Solution
Success Rate
Single Gateway
69% completion
Dual Gateway + Failover
92% completion
ClearEvent’s System
98% completion
This reliability is crucial, especially since 68% of attendees reconsider their participation after encountering payment issues.
Making Forms Work on All Devices
With mobile-first registration becoming the norm, optimizing forms is a must. Poorly functioning forms frustrate 74% of users, as noted earlier. To ensure smooth performance:
Keep page weight under 2MB by using lazy-loaded assets.
Follow accessibility standards to accommodate all users.
Use auto-formatting for fields like phone numbers and ZIP codes, and add HTML5 validation for email and date inputs. Additionally, multi-region servers and cached forms ensure uninterrupted registration, even during outages.
Making Registration Forms Shorter and Simpler
Forms with 5-7 fields see 25% higher completion rates compared to longer ones. This directly addresses the frustration 74% of users experience with unnecessary fields.
Reducing Form Fields to Prevent Dropoffs
Stick to collecting only the most important details during registration. These typically include:
Email address (98% critical)
Ticket selection (92% critical)
Payment details (89% critical)
Streamline the process by replacing email verification with real-time validation and postponing non-essential questions (like dietary preferences) to post-registration surveys.
Using conditional logic can also make forms feel shorter. This hides unnecessary fields until they’re relevant. For example, TechCon 2024 saw a major improvement:
“After implementing conditional logic to show meal preferences only for VIP ticket holders, our mobile completion rate jumped from 67% to 94%. The key was making forms feel shorter while still collecting necessary data.” – TechCon 2024 Event Director
This approach shows how you can balance compliance requirements with a better user experience.
Building Forms for Mobile Users
With most registrations happening on mobile devices, optimizing for smaller screens is essential. Here are some effective strategies:
Place key buttons in the bottom third of the screen for easy thumb access
Use single-column layouts to avoid clutter
Add native date pickers for smoother input
Browser autofill can also save users time, cutting input effort by 60%.
ClearEvent offers tools designed to simplify the registration process while keeping users engaged. Their form builder includes features like:
Drag-and-drop field prioritization
Smart grouping to collapse related fields
Step progress indicators
These tools helped reduce abandoned registrations by 27% compared to standard forms. Real-time tracking ensures forms stay under 90 seconds, which is the sweet spot for conversions.
For follow-up data collection, ClearEvent enables automated emails with personalized requests, aligning with CRM integration strategies covered later.
Managing and Protecting Attendee Data
Collecting attendee data is just the first step – keeping it secure is equally important. With 89% of attendees stating that mishandled data harms a brand’s reputation, safeguarding this information is a must. Event data breaches surged by 72% in 2024, highlighting the need for strong data management practices.
Connecting CRM and Email Tools
Ensuring data flows smoothly between systems requires meticulous integration. Automated syncing is key to maintaining accuracy and efficiency. Here’s what helps:
Unique attendee IDs to track individuals across platforms
Instant update alerts to reflect changes in real-time (within 15 seconds)
ClearEvent’s webhook simplifies this process by automatically syncing registration data with marketing tools, cutting manual entry errors by 68%.
Keeping Attendee Data Safe
Protecting attendee data doesn’t have to be complicated. Here are some essential security features:
Feature
Purpose
End-to-end encryption
Prevents unauthorized access
AES-256 storage
Protects sensitive information
Role-based access
Restricts data to authorized users
ClearEvent’s permission matrix offers 42 specific access levels, balancing security and usability to maintain attendee trust while ensuring smooth event operations.
Updating Data Across Systems
Accurate data is crucial. Automated validation and synchronization help ensure data completeness (>95%), reduce duplication (<2%), and keep sync speeds under 30 seconds.
Real-time validation during registration minimizes errors. For example, ClearEvent’s form builder automatically detects common issues, preventing them from spreading across systems.
For disaster recovery, ClearEvent employs:
“Hourly incremental and daily full backups with multi-cloud storage ensure 99.999% reliability”
This robust approach keeps data secure and accessible, directly supporting the efficient check-in processes discussed in the next section.
sbb-itb-fd7582d
Speeding Up Check-In Lines
Long check-in lines can frustrate attendees and create a poor first impression. Efficient check-in processes are crucial, as wait times under 90 seconds lead to an 85% increase in attendee satisfaction. Here’s how you can streamline this critical part of the attendee journey while maintaining strong data security practices.
Reducing Wait Times at Check-In
Using self-service kiosks equipped with QR or barcode scanners can process 50-75 attendees per hour, compared to just 20-30 attendees with manual methods. To ensure smooth check-ins, consider these staffing recommendations:
Check-in Method
Staff-to-Attendee Ratio
Processing Speed
Self-service Stations
1:100
50-75 attendees/hour
Assisted Check-in
1:75
20-30 attendees/hour
Mobile Staff
2 per 1,000 attendees
40-60 attendees/hour
The layout of your check-in area also matters. Use parallel queues and clear signage, such as “Registration A-M” and “N-Z”, to direct attendees efficiently. For larger events, staggering check-in times can reduce peak congestion by up to 40%.
Solving Badge Printing Issues
Badge printing can often be a bottleneck, with printer jams accounting for 32% of common failures. To avoid delays, use industrial-grade printers, stock 20% more supplies than estimated, and offer digital backup badges through event apps.
Preparing Staff for Check-In
Well-trained staff can make a big difference. A three-step training process works best:
Software simulations to familiarize staff with the system.
Role-playing scenarios to handle common issues like duplicate registrations.
Emergency protocols to address system outages.
Real-time monitoring is also key. If wait times exceed 7 minutes, alerts can prompt additional staff deployment to prevent delays. For added security, keep offline registration kits on hand, complete with printed attendee lists and temporary badges. This ensures you’re prepared for any unexpected system failures.
Tools and Methods That Work
These tools tackle the main technical and user experience challenges, combining solutions into systems that help avoid registration issues.
Choosing the Right Registration Platform
When picking a registration platform, focus on features that directly improve the registration process:
Feature Category
Key Requirements
Impact on Registration
System Performance
99.9%+ uptime, 10k+ concurrent users
Prevents crashes during busy periods
Mobile Compatibility
Mobile-friendly forms, wallet options
Boosts mobile completion rates by 41%
Security
Real-time threat monitoring
Safeguards attendee data
Integration
Real-time data validation
Syncs data across systems in under 5 seconds
Platforms like ClearEvent can handle up to 50,000 registrations per hour with crash rates below 1%.
Building Better Registration Steps
Streamlining the registration process can make a big difference. Research shows that improving form design leads to better completion rates. Here’s how to optimize:
Minimize Form Fields: Stick to 5-7 essential fields to reduce drop-offs. ClearEvent reports a 63% drop in form abandonment with this method. Collect additional details from returning users over time.
Use Smart Validation: Add real-time validation with clear error messages to avoid submission issues. ClearEvent supports browser compatibility checks for Chrome, Safari, and Firefox (2020 onward), achieving a 98% success rate.
Focus on Mobile Features: Incorporate digital wallet options like Apple Pay or Google Pay to speed up mobile registrations by 55%. This is especially important as mobile sign-ups continue to grow.
Using ClearEvent’s Key Features
ClearEvent stands out by offering a combination of powerful tools:
Automated Data Management: Keeps attendee data consistent across all event systems.
Advanced Security: GDPR-compliant tools protect attendee privacy, even after the event ends.
Smart Check-In Solutions: Fraud detection blocks 98% of fake registrations and reduces duplicates by 73%.
“Automated ID verification achieves 98% fraud prevention accuracy while duplicate detection reduces fake accounts by 73%”.
Conclusion: Better Registration, Better Events
Streamlining registration processes can directly improve event outcomes in several key areas:
Impact Area
Results
Technical Performance
More revenue thanks to reliable payment systems
Check-in Efficiency
Lines reduced by 40%
Data Management
Systems sync 75% faster
Support Requirements
Help tickets drop by 90%
These results build on the mobile-friendly strategies and check-in tools discussed earlier. Event experts note that “attendees form lasting impressions within the first 7 minutes of interaction”, making a smooth registration process essential.
Organizations also gain long-term benefits, such as:
A 19% boost in sponsorship ROI due to better data collection
Enhanced efficiency and a better overall attendee experience
Reducing mobile abandonment rates from 67% to 22% demonstrates how critical mobile optimization is. By combining the technical tools, data practices, and user experience improvements mentioned earlier, organizations can ensure a hassle-free registration process that leaves a lasting impact.
Additionally, modern CRM systems show a 45% increase in email open rates when segmented follow-ups are used, supporting the synchronization strategies highlighted in Managing and Protecting Attendee Data.
Imagine this: Your event attendees not only show up but actively engage with one another, foster relationships, and become ambassadors for your brand. For example, a nonprofit conference used Slack to connect attendees, leading to a 25% increase in engagement and a significant rise in post-event collaborations. This isn’t just an ideal scenario; it’s the tangible outcome of building a strong community around your event. Learn how ClearEvent and integrated platforms can help you achieve this level of success.
As an event manager, you know that organizing events isn’t just about logistics; it’s about creating meaningful experiences. And at the heart of every memorable event is a vibrant, engaged community. In this guide, we’ll explore practical strategies, tools, and insights to help you create a thriving community around your events.
Identifying the Problem: Fragmentation and Engagement Challenges
Event managers often face these pain points:
Tool Overload: Juggling multiple platforms for communication, registration, and attendee engagement. For example, many organizers rely on separate tools like ticketing systems, Google Forms for feedback, and email marketing platforms, which can lead to inefficiencies and missed connections. Read more about ClearEvent’s all-in-one solution for event management.
Low Engagement: Difficulty encouraging attendees to connect meaningfully before, during, and after the event. For instance, an organizer might send event updates via email but struggle to facilitate real-time interactions among attendees, leading to disengagement.
Lack of Continuity: Communities dissolve after the event ends, missing opportunities for long-term engagement. One organizer noted that while their Facebook Group had good traction during the event, they lacked a post-event plan, causing momentum to fade quickly.
The Solution: Centralized and Strategic Community Building
By integrating event management tools like ClearEvent with platforms such as Slack, Discord, or Facebook Groups, you can:
Streamline communication.
Foster attendee interactions beyond the event.
Build lasting relationships that boost loyalty and repeat attendance.
Tactical Implementation: Building a Community Step-by-Step
Step 1: Set Clear Goals for Your Community
Determine the purpose of your community:
Networking and collaboration among attendees.
Knowledge sharing and learning opportunities.
A space for ongoing discussions and future event promotion.
Example: For a nonprofit conference, set up a Slack workspace with channels like #introductions, #industry-news, and #event-highlights to encourage networking and resource sharing.
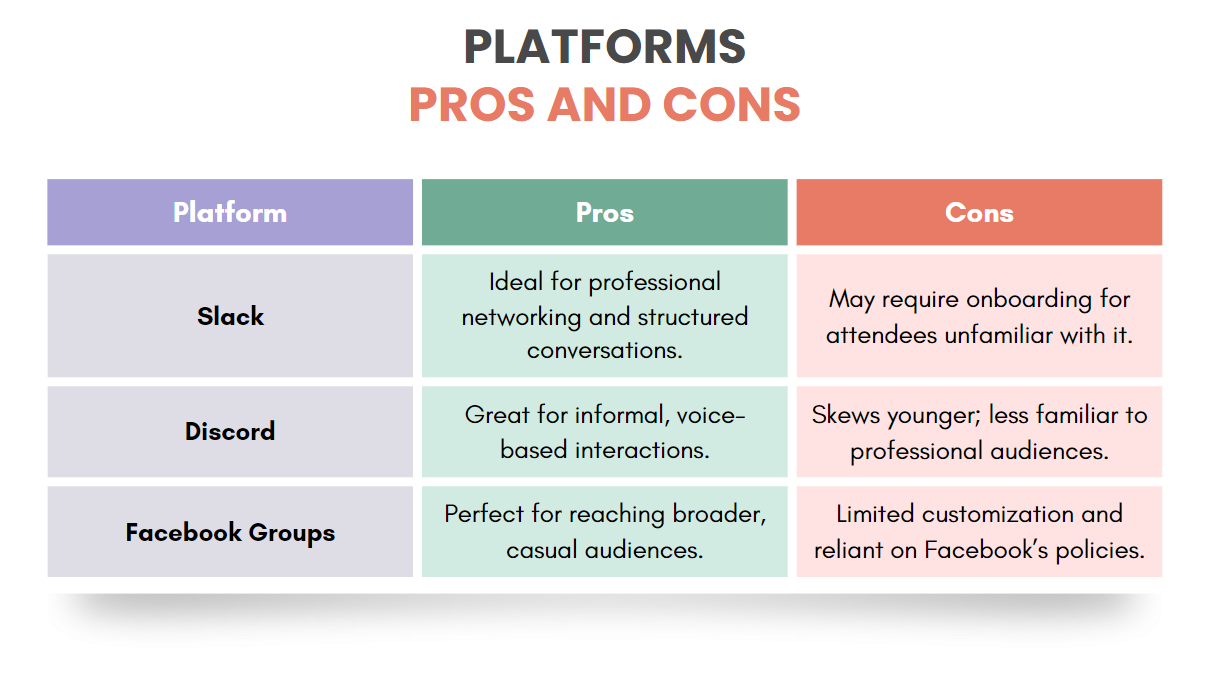
Step 2: Choose the Right Platform
Select a platform that aligns with your audience’s preferences:
Statistic: 56% of attendees believe a mobile app enhances their event experience, offering mobile-friendly platforms like ClearEvent and Slack is essential.
Step 3: Integrate Tools with Your Event Platform
Leverage ClearEvent’s messaging and event portal features to:
Send personalized Slack invites to attendees.
Share event updates, schedules, and exclusive content seamlessly.
Implementation Example: Use ClearEvent’s bulk messaging feature to invite attendees to your Slack workspace, providing a link and simple onboarding instructions.
Step 4: Design an Engaging Community Space
Structure your community for maximum engagement:
Create channels for specific topics (e.g., #tech-talk, #vendor-showcase).
Set up a #start-here channel with FAQs and guidelines.
Add interactive elements like polls or live Q&A sessions.
Statistic: Events that incorporate interactive elements see up to 80% higher engagement rates.
Step 5: Sustain Engagement Post-Event
Keep the momentum going after your event:
Share recordings, key takeaways, and resources in the community. For example, a nonprofit conference organizer shared session recordings and resource links in their Slack workspace post-event, resulting in a 20% increase in follow-up discussions and attendee satisfaction. Discover how ClearEvent’s Event Portal Web App simplifies resource sharing.
Organize follow-up webinars or Q&A sessions.
Announce future events and offer exclusive discounts to community members.
Example: A trade show organizer used Discord to share vendor highlights post-event, resulting in a 30% increase in attendee interactions.
Expert Insights and Best Practices
Insight from an Expert
“Communities thrive on consistent interaction and value creation. By dedicating resources to community management—even if it’s just one person—you can transform attendees into lifelong advocates for your events.” – Sarah L., Event Strategist with over 10 years of experience in building and nurturing event communities for nonprofits and corporate clients.
Best Practices
Moderate Effectively: Assign moderators to ensure discussions remain respectful and on-topic.
Encourage Networking: Host virtual icebreakers or introduce attendees with shared interests.
Recognize Contributions: Highlight active members through shout-outs or rewards.
Keep Content Fresh: Regularly post updates, industry news, or interactive content to maintain interest.
Gather Feedback: Use polls or surveys to understand what members value most.
Actionable Takeaways
Use ClearEvent’s:
Messaging feature to invite attendees to a Slack or Discord workspace.
Event Portal Web App to add a button to direct attendees to your community channel.
Create dedicated channels for networking, resources, and event updates.
Host live Q&A sessions during your event to boost real-time engagement.
Share exclusive content and discounts with community members post-event.
Regularly analyze engagement metrics to refine your community strategy.
Take the Next Step
Building a community around your events is more than a strategy—it’s an investment in long-term success. By leveraging the right tools and creating spaces for meaningful interaction, you can transform your events into experiences attendees will remember and talk about for years.
Start small. Invite your attendees to a Slack workspace or create a Facebook Group. Use ClearEvent to streamline invitations and communication. And watch as your event community becomes a hub of connection, learning, and inspiration.
Why Choose ClearEvent for Community Building?
Integrated Communication: Streamline attendee interactions with built-in messaging and invites.
Seamless Engagement: Use the Event Portal to keep your attendees connected.
Customizable Tools: Tailor your event portal and community outreach to fit your event’s needs.
Time-Saving Features: Simplify management with bulk messaging and attendee grouping.
Ready to build your community? Explore how ClearEvent’s features can simplify your event planning and community-building efforts. Schedule a demo today!